
 We all know the proportionality that two signatures retain, whether we sign in a small space or in a larger one, the signature will not be exactly the same (if two signatures are exactly the same one of them is false), but it will retain a general proportionality unique to the signer.
Many times the proportional analysis of the general geometry of the signature is of great help, this type of analysis has some advantages, for example if the quality of the image is bad, it will not matter, since the analysis is performed based on the real dimensions of the strokes, not on the color shades of the pixels.
We wanted to use a mathematical method, never used to analyze proportionality in writing, the golden ratio, and also to develop a revolutionary algorithm, which not only analyzes the actual measures of proportion, but also takes into account other factors in the calculation, such as a percentage of confidence, which varies the final result, if the two signatures are completely equal, since this fact denotes an axiomatic falsification.
To do this after several months of work and empirical tests, we present a new FDM (Fibonacci Digital Modeller) tool that will incorporate from now on NEGA, it will be free for users with active license, since, they will be able to upgrade to the new version.
The method used is based on the mathematical succession of Fibonacci, in this infinite succession, there is a proportion between the successive numbers that make it up that tends to a defined limit, as we increase the series, the golden number, 1.618.
For this reason this series is used to define the golden geometry throughout the signature, generating the resulting golden spiral, a special algorithm has been devised that automatically searches and positions some points around the perimeter of the signature, following the golden quadrants of the spiral generated, these points can be positioned manually, with the mouse, in the case that the algorithm has considered some line, part of a stamp or rubber stamp, an antefirma, a line or something else, confusing it with a stroke of the signature, and this causes erroneous results, to do this we have devised a very easy color code, which indicates in which area of the quadrant, we have to position the point, so that it is within the trajectory of the stroke.
The calculation performed by the algorithm is based on a proportional system, therefore, it is not affected by the size of the signature photo.
The FDM analysis is made from photos classified by project, previously saved and generated in NEGA of the signatures we want to analyze. Then they are analyzed in the FDM tool one by one and the analysis is saved. Subsequently, multiple comparisons can be generated for each project, and a complementary graph can be generated in addition to the final percentage results. The analysis is done in duplicate automatically, always combining the Know signatures with all the Questioned signatures in the list. The final result is presented in a comprehensive PDF report, which can be easily shared. All the project files are saved in a directory on the desktop, called “My Projects NEGA”, in case you want to consult them later.
Due to the complexity of the mathematical analysis, we have chosen to offer three percentage results.
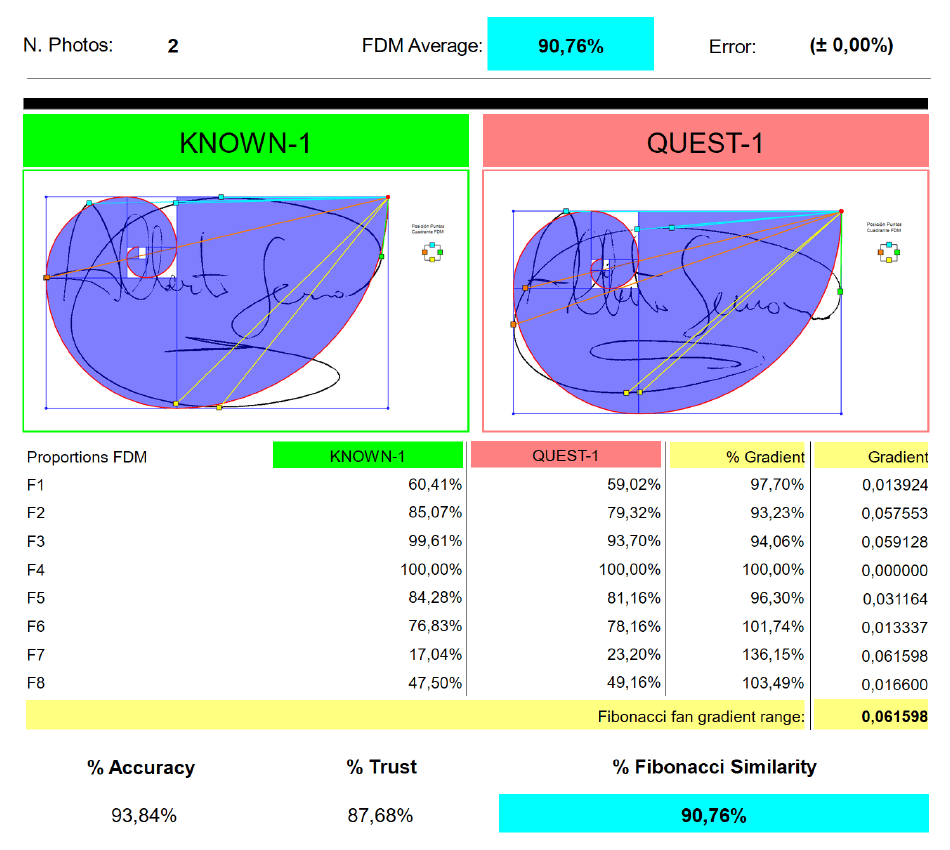
% Accuracy of matching
It indicates a real percentage of proportional accuracy, which is reflected in the graph, equal graphs will have a matching accuracy of 100%, but that does not mean that the writings are not false, because two signatures traced are false, a person does not always sign the same in terms of measures, but it retains the proportionality in the overall shape of the signature.
% Trust collation
This value will indicate the confidence level of the previous section, if the matching accuracy is too high, we will have a low value in this section, it will stabilize, to take higher values, in matching accuracies that are acceptable, going down again, for accuracy values below 80%.
% Fibonacci Similarity
This is the final result, which presents a Fibonacci similarity percentage indicating the following background colors:
If the result is between 80% and 100% (positive similarity)
If the result is between 60% and 79% (undetermined similarity)
If the result is below 60% (negative similarity)
This value is calculated taking into account the above accuracy and confidence data.
Excellent tool for forensic examination of complex handwritten signatures.
A very good complement to traditional forensic analysis techniques.
Thank you.